Chart of Accounts: Definition, Guide and Examples
A chart of accounts helps organize your business’s transactions to reveal where money is coming from and going to.
Many, or all, of the products featured on this page are from our advertising partners who compensate us when you take certain actions on our website or click to take an action on their website. However, this does not influence our evaluations. Our opinions are our own. Here is a list of our partners and here's how we make money.
Small businesses may make hundreds or even thousands of transactions each year. A comprehensive chart of accounts (COA) helps you record them.
Your accounting software should come with a standard COA. But it’s up to you and your bookkeeper or accountant to keep it organized.
Here’s a breakdown of how a COA works, followed by examples and best practices.
What is a chart of accounts?
A chart of accounts is the filing cabinet at the heart of your accounting system. Businesses use the COA’s list of account names to group transactions into different buckets. Each account usually has an account number and a description, too.
Why is the chart of accounts important?
Some of your most important financial reports depend on data from the COA. Without accurate information there, it can be hard to analyze your business’s position.
For instance, you’ll use asset, liability and equity accounts to generate a balance sheet. This report conveys your business’s current financial health and whether it owes money. Revenue and expense accounts make up the income statement. This provides insight into your profitability over time.
The COA helps you keep accurate records for filing taxes, too. That way, you can properly report your income and expenses.
How is a chart of accounts structured?
COAs are typically made up of five main accounts. You’ll generally list asset, liability and equity accounts first. Revenue and expense accounts come next.
Here’s a rundown of each:
- Assets: Any resource your company owns that provides value. These could include cash, accounts receivable, inventory, equipment or vehicles.
- Liabilities: Any debt your company owes. These could include accounts payable, business loans and taxes payable.
- Equity: What’s left after subtracting a company's liabilities from its assets. These could include common stock, preferred stock and retained earnings.
- Revenue: The money your business brings in from the sale of its goods or services. This may include sales or operating revenue, as well as interest revenue.
- Expenses: All the types of money and resources a business spends in an effort to generate revenue. To calculate net income, subtract expenses from revenue. Expense accounts may include cost of goods sold, payroll, rent, travel, depreciation and utilities.
Each main account has multiple subaccounts as well. For example, lots of businesses have a “meals” subaccount under the main expenses account.
Most accounting software products set you up with a standard COA or let you import your own. Still, you should have your bookkeeper or accountant look over it. They can help determine whether you need to add industry-specific accounts. For instance, a manufacturing company would likely have a raw materials account.
Need accounting software with a built-in COA?
Most accounting software products include a basic COA that can help you get started. Here are some of our top picks:
- QuickBooks Online: Best for most small businesses.
- Xero: Best user-friendly interface.
- Wave: Simplest free option.
- Zoho Books: Best scalable free option.
How do you set up subaccounts?
Your accounting software should come with standard subaccounts. For example, you’ll probably find credit card and sales tax subaccounts in the liabilities account. These built-in options should cover the basics. But you may still need to add subaccounts that are specific to your business.
This is especially true for expense accounts, which are critical to claiming tax deductions. For example, consider a “meals” subaccount again. Meals for company-wide events, like a holiday party, qualify for a 100% deduction. But employee meals only qualify for a 50% deduction.
If your business pays for both, you might create two “meal” subaccounts (‘company meals” and “employee meals”). That way, you can claim the correct deductions.
However, you probably wouldn’t need separate accounts for each utility. The IRS offers the same write-offs for your electric bill as it does your water bill.
If you think you need to add more subaccounts, make sure to check in with your bookkeeper first. And try not to go overboard — the average small business shouldn’t need more than 250 accounts total.
What do the account numbers mean?
Traditionally, each account and subaccount in the COA has a number. Accountants use the first digit of each number to identify the type of account.
For example, larger businesses generally label asset accounts 1000 to 1999 (or 100 to 199). Liabilities are generally 2000 to 2999 (or 200 to 299). Small businesses with fewer than 250 accounts might have a different numbering system.
🤓 Nerdy Tip
Number codes make it easy to ID different types of transactions. But so does your accounting software. When you look at your COA in it, you might notice a “view register” option next to the account name. If you click this, you’ll see a record of all the transactions you've associated with that account over time. This can let you spot errors and misclassifications. Chart of accounts examples
The main accounts within the COA are pretty consistent. But accounting software may display them differently. Fortunately, many products have videos that walk you through the details.
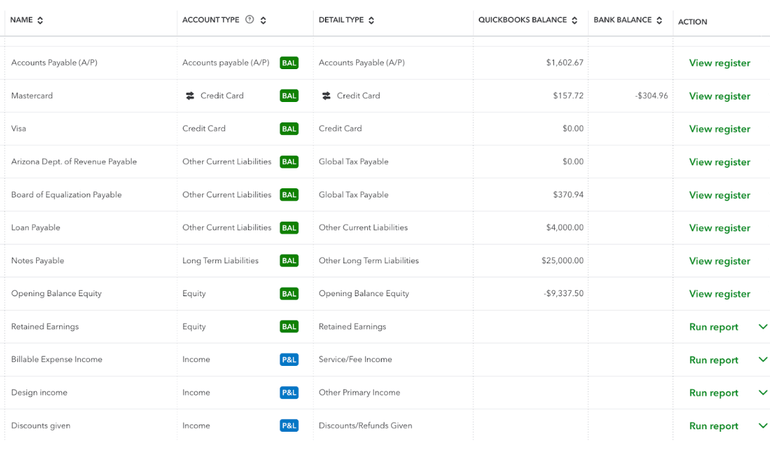
Here’s a COA example from QuickBooks Online’s demo account:

This particular COA has color-coded tags in the "account type" column. These tell you whether the transaction is factored into the balance sheet or profit and loss statement. In this example, the “credit card” account type is considered a liability. You can also run reports from QuickBooks’ COA.
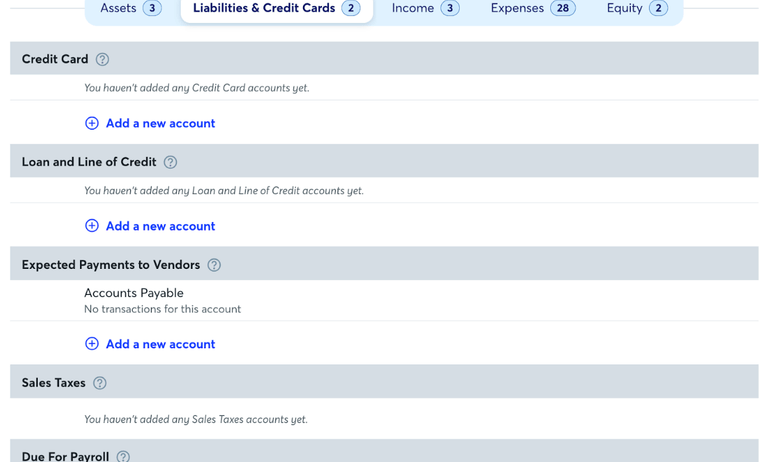
Wave, in contrast, displays its COA in a simpler way. Instead of organizing the page by transaction, you choose which main account you’d like to view.

How often should a chart of accounts change?
Your COA shouldn’t change much. Keeping it consistent year-over-year can let you compare accounts and see how you're managing your business’s finances over time.
You should do an annual review for consolidation opportunities or outdated accounts, though. This will make handling your accounts more manageable.
But in the interest of not messing up your books, wait until the end of the year. Deleting or combining accounts mid-year could create headaches come tax season. However, you can add new accounts at any time.
Stacy Kildal, a former Fundera writer, contributed to this article.
A version of this article was first published on Fundera, a subsidiary of NerdWallet.
Frequently Asked Questions
What is the definition of a chart of accounts?
A chart of accounts is a catalog of account names used to categorize transactions and keep your business’s financial history organized. The list typically displays account names, details, codes and balances. There’s often an option to view all the transactions within a particular account, too.
What is the best way to structure a chart of accounts?
A chart of accounts is made up of five main accounts from the balance sheet and income statement: assets, liabilities, equity, revenue and expenses. These accounts are universal, and your business may incorporate additional industry-specific accounts and subaccounts.
How do you set up a chart of accounts?
Thanks to accounting software, chances are you won’t have to create a chart of accounts from scratch. Accounting software products generally set you up with a basic chart of accounts that you can work with your accountant or bookkeeper to amend, according to your industry and your business’s complexity.
Article sources
NerdWallet writers are subject matter authorities who use primary,
trustworthy sources to inform their work, including peer-reviewed
studies, government websites, academic research and interviews with
industry experts. All content is fact-checked for accuracy, timeliness
and relevance. You can learn more about NerdWallet's high
standards for journalism by reading our
editorial guidelines.
More like this
Related articles


